Financial Reporting & Dashboards
Enterprise Reporting
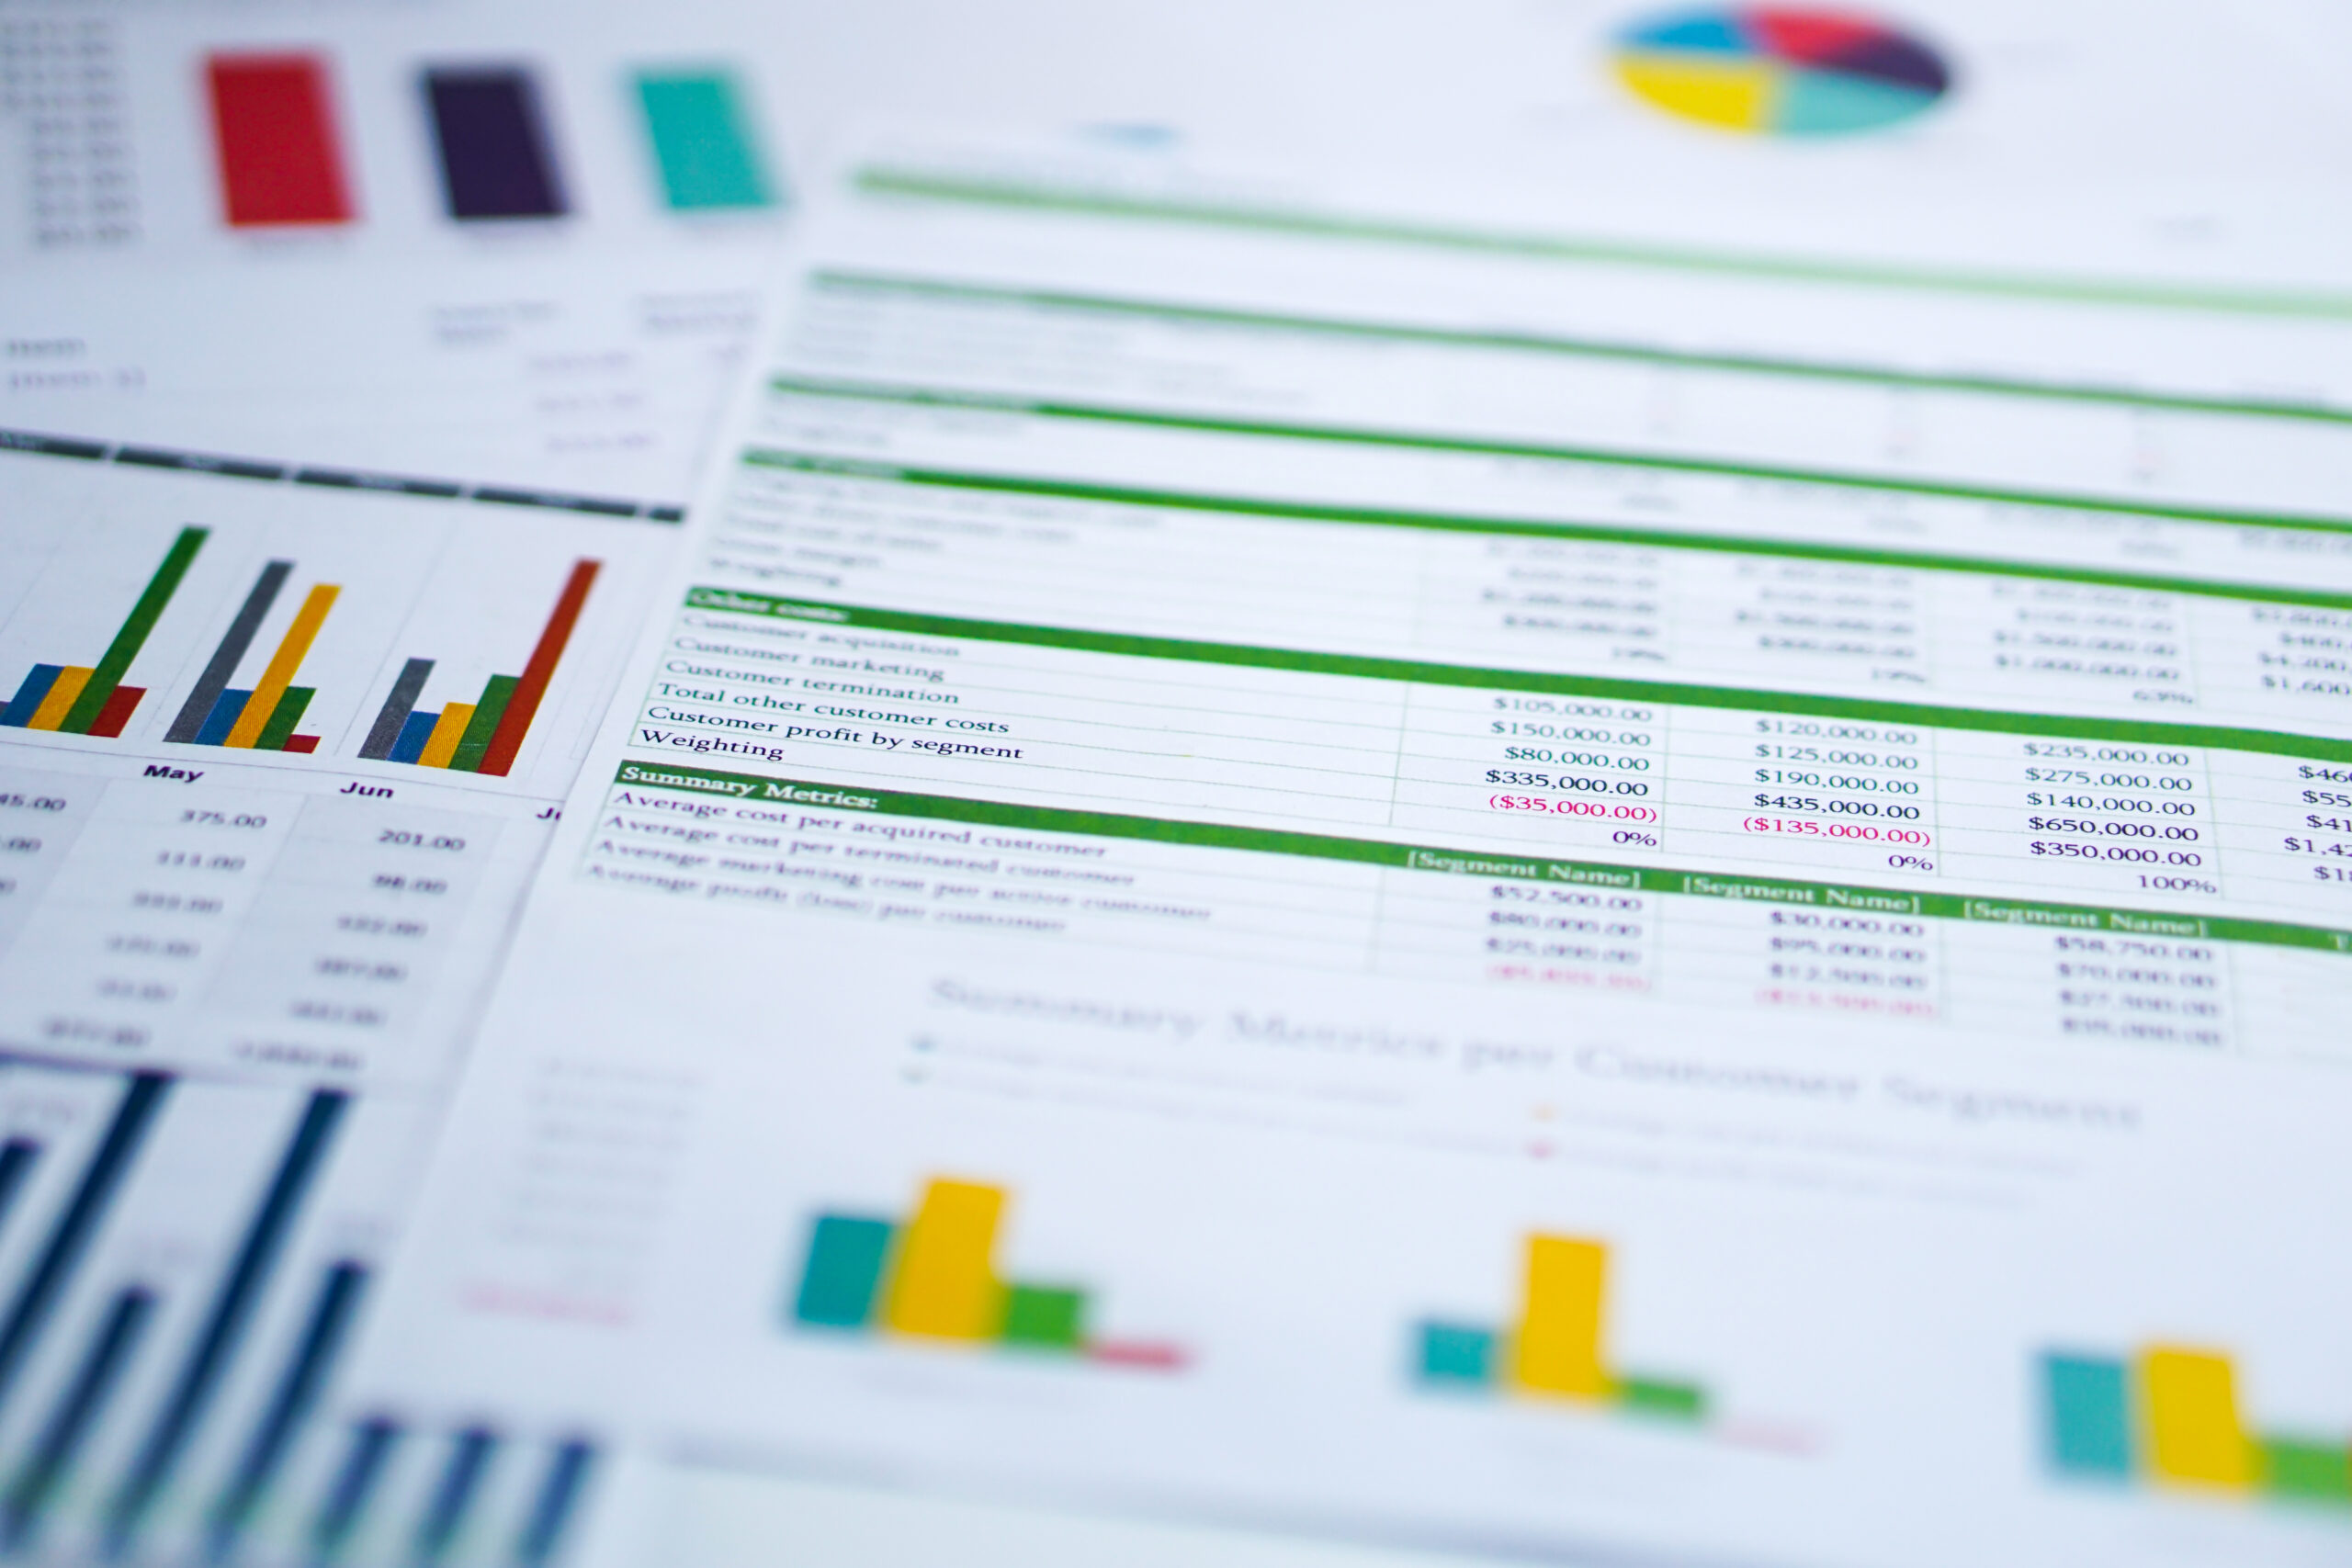
For too long, finance departments’ C-suite reporting and analysis capabilities have been constrained either by Excel itself or feature-poor third-party technologies. A3 unleashes Excel’s potential as a financial reporting and dashboard creation tool.
A3 empowers financial planning and analysis professionals to effortlessly combine data from different sources and produce rich content and beautiful presentations for variance reporting, ad hoc analysis and interactive what-if modeling. Finally, your team can leverage the full extent of their Excel modeling skills to create and distribute highly meaningful, actionable financial reports.

A3 delivers enterprise-grade management reporting and financial analysis features to finance teams across the Fortune 500. We make it easy for FP&A professionals to build the dashboards they need and track the KPIs executives want to be tracked, all without leaving the comfort of Excel.
A3 empowers finance professionals to do their best work when it comes to budgeting, rolling forecasts, expense budgeting, compensation planning, and more. Users enjoy visually intuitive, colorful, and compelling templates, blink-of-an-eye performance, incredibly simple data import/export, and totally secure collaboration – all without leaving the application they’ve been using for years.
One-click what-if analyses. Integrated reporting. Bottom-up and top-down methodologies. If you need it, A3 has it.